There are some differences on setting up RRDReST on CentOS 8, Almalinux 9 vs CentOS 7
If you are setting this up to use with LibreNMS and Grafana, check out the rest of the this article. https://www.incredigeek.com/home/setting-up-grafana-on-librenms/
Installing RRDReST
All the docker commands have been swapped out for podman.
- Install Docker
- Create a compose file
- Run compose file to create container
Install docker
Podman is default on CentOS 8 and later and is, for the most part, a drop in replacement for Docker.
sudo yum install -y podman podman-compose
sudo systemctl enable podman
Create a Podman / Docker network to use. We’ll use this to assign a static IP address to the container. We’ll call the network rrdnet, and we’ll use the 10.89.2.0/24 range.
sudo podman network create --subnet=10.89.2.0/24 rrdnet
Create podman-compose file
Create a docker compose file
vi podman-compose.yml
Add the following
version: "3.5"
services:
  rrdrest:
    image: michaelwadman/rrdrest:latest
    container_name: rrdrest
    restart: always
    volumes:
      - "/opt/librenms/rrd:/opt/librenms/rrd:Z"
    environment:
      - TZ=America/Denver
    networks:
      rrdnet:
        ipv4_address: 10.89.2.2
        ipam:
          driver: default
          config:
            - subnet: 10.89.2.0/24
networks:
  rrdnet:
    external: true
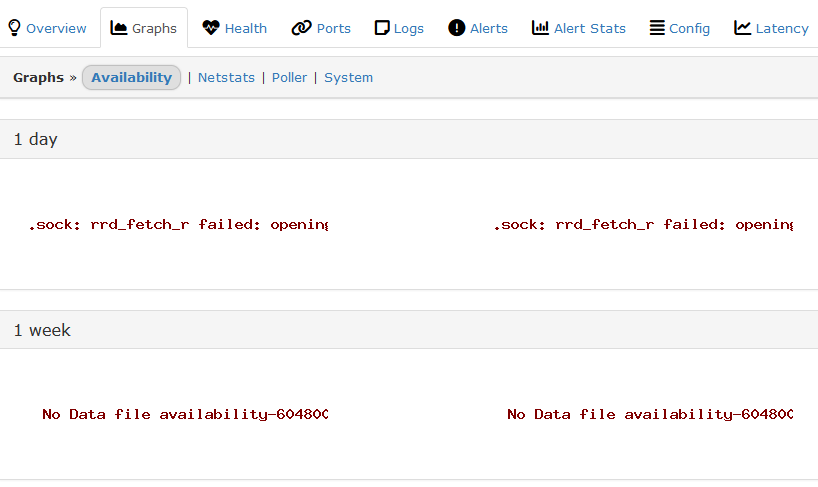
Change the TZ to your time zone. If you have issues with the graphs, most likely something is off with the time zone between this container and Grafana/LibreNMS server
Note that the :Z is needed for SELinux to allow RRDReST to access the sub folders. AKA. the rrd files.
The container should have a 10.89.2.2 IP address. You can take all the networking sections out, and the container will receive DHCP. The problem is that the IP can change, breaking our graphs in Grafana.
Run RRDReST Container
Save the file. Then start and setup the container with
sudo podman-compose up -d
You will need your docker container IP address to setup the connection in Grafana. If you used the above docker-compose config, then it should be 10.89.2.2.
sudo docker exec -it rrdrest ip addr | grep eth0
Configure RRDRest to start on system boot with systemd
The “restart: always” option does not appear to work on systems with podman. We can create a systemd service instead.
Use the following command to automatically create a systemd file.
sudo podman generate systemd rrdrest
Copy the contents to a new file in /etc/systemd/system/
/etc/systemd/system/rrdrest.service
If you end up deleting the rrdrest container, you’ll need to update the systemd file again. You may need also need to run “systemctl daemon-reload”
Enable the new service with
systemctl enable rrdrest
Congratulations. RRDReST is now setup and running.
You can verify it’s running by checking with Podman / Docker.
sudo podman ps
You can also ping it
ping 10.89.2.2