Go to “Kibana/app/fleet/agents”
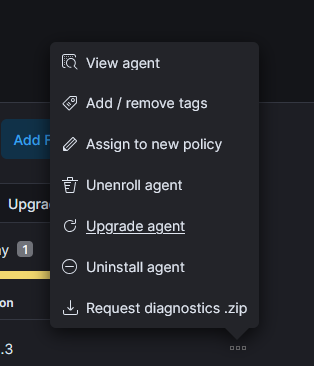
Click the 3 dots on the host and select uninstall agent.
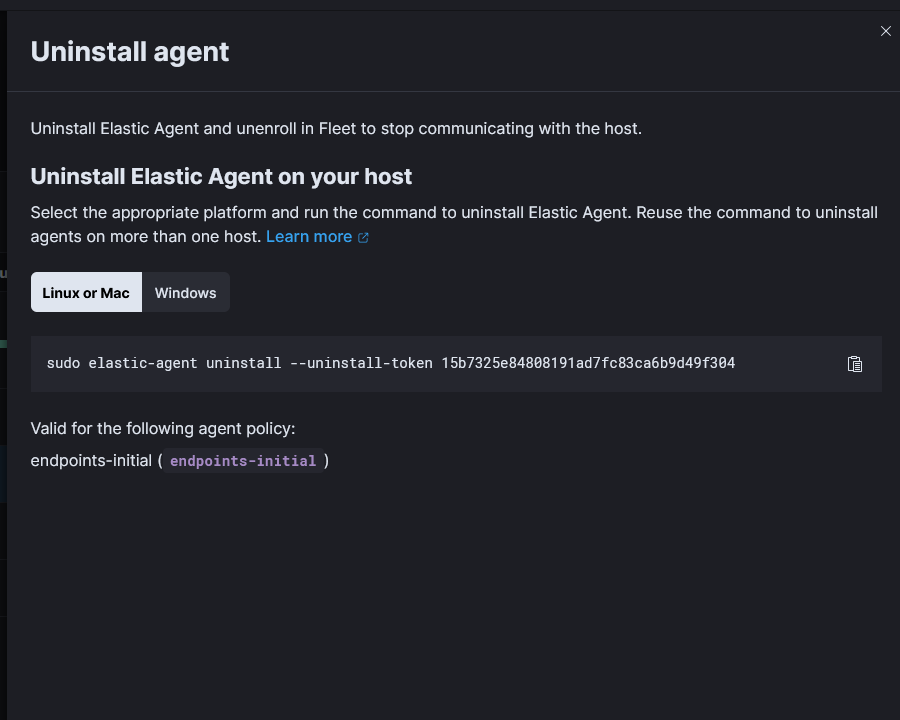
Select the command to uninstall and run it on the host.
Finally, hit the three dots and unenroll agent.

Go to “Kibana/app/fleet/agents”
Click the 3 dots on the host and select uninstall agent.
Select the command to uninstall and run it on the host.
Finally, hit the three dots and unenroll agent.
Install and enable auditd with
sudo dnf install auditd
sudo systemctl enable auditd
sudo systemctl start auditd
Add a file or directory to monitor with
auditctl -w /etc/passwd -k password
-w is watch path
-k is a filter key we can use later to search through logs
Now we can search with ausearch
ausearch -k password
There are already some preconfigured rules in /usr/share/audit/sample-rules/
We can copy those to /etc/auditd/rules.d/ and use them.
cd /usr/share/audit/sample-rules/
cp 10-base-config.rules 30-stig.rules 31-privileged.rules 99-finalize.rules /etc/audit/rules.d/
augenrules --load
Note on the 31-privileged.rules file. You’ll need to run the commands in the file which will create a new file. Then we can copy that to “/etc/auditd/rules.d/”
find /bin -type f -perm -04000 2>/dev/null | awk '{ printf "-a always,exit -F path=%s -F perm=x -F auid>=1000 -F auid!=unset -F key=privileged\n", $1 }' > priv.rules
#find /sbin -type f -perm -04000 2>/dev/null | awk '{ printf "-a always,exit -F path=%s -F perm=x -F auid>=1000 -F auid!=unset -F key=privileged\n", $1 }' >> priv.rules
#find /usr/bin -type f -perm -04000 2>/dev/null | awk '{ printf "-a always,exit -F path=%s -F perm=x -F auid>=1000 -F auid!=unset -F key=privileged\n", $1 }' >> priv.rules
#find /usr/sbin -type f -perm -04000 2>/dev/null | awk '{ printf "-a always,exit -F path=%s -F perm=x -F auid>=1000 -F auid!=unset -F key=privileged\n", $1 }' >> priv.rules
#filecap /bin 2>/dev/null | sed '1d' | awk '{ printf "-a always,exit -F path=%s -F perm=x -F auid>=1000 -F auid!=unset -F key=privileged\n", $2 }' >> priv.rules
#filecap /sbin 2>/dev/null | sed '1d' | awk '{ printf "-a always,exit -F path=%s -F perm=x -F auid>=1000 -F auid!=unset -F key=privileged\n", $2 }' >> priv.rules
#filecap /usr/bin 2>/dev/null | sed '1d' | awk '{ printf "-a always,exit -F path=%s -F perm=x -F auid>=1000 -F auid!=unset -F key=privileged\n", $2 }' >> priv.rules
#filecap /usr/sbin 2>/dev/null | sed '1d' | awk '{ printf "-a always,exit -F path=%s -F perm=x -F auid>=1000 -F auid!=unset -F key=privileged\n", $2 }' >> priv.rules
And Copy priv.rules to /etc/audit/rules.d/31-privileged.rules. Overwrite the file there if needed.
cp ./priv.rules /etc/audit/rules.d/31-privileged.rules
Load the rules.
augenrules --load
The problem: Linux servers have been configured to send their local syslogs to LibreNMS, but are not showing up under the LibreNMS -> DEVICE -> Logs-> Syslog
After a bit of troubleshooting, found that the issue is the hostname being sent with the logs is different than what LibreNMS has for the device. It appears that some Linux distributions will or can use an abbreviated system hostname. There is a section in the LibreNMS docs about this
https://docs.librenms.org/Extensions/Syslog/#matching-syslogs-to-hosts-with-different-names
We can either do what the docs say, or we can set the host name in the rsyslog.conf file on each of the servers.
Log into the server and open up
sudo vi /etc/rsyslog.conf
At the very top, add the following line to set the hostname
$LocalHostName host.server_name_fqdn.com
Save the file and restart rsyslog
sudo systemctl restart rsyslog
Refresh the page to verify the logs are showing up in LibreNMS.
If you are still having issues, you may want to check the following
Using the LibreNMS documentation for setting up syslog-ng so LibreNMS can ingest logs from Cisco, Mikrotik, Ubiquiti etc. equipment.
https://docs.librenms.org/Extensions/Syslog/
First thing we need to do is enable syslog for LibreNMS. Edit the /opt/librenms/config.php and add or enable
$config['enable_syslog'] = 1;
Install syslog-ng with dnf or yum.
sudo dnf install -y syslog-ng
Create a config file for LibreNMS
vi /etc/syslog-ng/conf.d/librenms.conf
Put the following in the config file
source s_net {
        tcp(port(514) flags(syslog-protocol));
        udp(port(514) flags(syslog-protocol));
};

destination d_librenms {
        program("/opt/librenms/syslog.php" template ("$HOST||$FACILITY||$PRIORITY||$LEVEL||$TAG||$R_YEAR-$R_MONTH-$R_DAY $R_HOUR:$R_MIN:$R_SEC||$MSG||$PROGRAM\n") template-escape(yes));
};

log {
        source(s_net);
        source(s_sys);
        destination(d_librenms);
};
Restart and enable syslog-ng
sudo systemctl restart syslog-ng
sudo systemctl enable syslog-ng
If we are running SELinux, we’ll need to make and apply a module to let the logs show up in the web interface.
vi librenms-rsyslog.te
Put the following in the file
module mycustom-librenms-rsyslog 1.0;

require {
        type syslogd_t;
        type httpd_sys_rw_content_t;
        type ping_exec_t;
        class process execmem;
        class dir { getattr search write };
        class file { append getattr execute open read };
}

#============= syslogd_t ==============
allow syslogd_t httpd_sys_rw_content_t:dir { getattr search write };
allow syslogd_t httpd_sys_rw_content_t:file { open read append getattr };
allow syslogd_t self:process execmem;
allow syslogd_t ping_exec_t:file execute;
Now run the following commands to make and apply our SELinux module.
checkmodule -M -m -o librenms-rsyslog.mod librenms-rsyslog.te
semodule_package -o librenms-rsyslog.pp -m librenms-rsyslog.mod
sudo semodule -i librenms-rsyslog.pp
First we need to drop into configuration mode
conf t
Now we run the following command. Change ip-address to the address of you remote syslog server.
logging host ip-address
You will want to make sure that your time/timezone is correct.
Change UTC and 0 to your your timezone and how many hours off UTC you are. For example for EST you would do EST -5
clock timezone UTC 0
Here are just the commands
terminal config
logging on
logging logserveraddress
clock timezone UTC 0
quit
wr
Thanks to the guys who put together the information at the following links.
https://wadman.co.nz/2021/01/02/Viewing-LibreNMS-data-in-Grafana/
https://www.reddit.com/r/LibreNMS/comments/ojc8cc/how_to_almost_natively_integrate_librenms_and/
I ran into some issues trying to get this to work. So here are some of my notes. I already had a LibreNMS installation set up.
NOTE FOR CENTOS 8, ALMALINUX 8 and 9
The steps for installing RRDReST are slightly different. Check out the following post.
https://www.incredigeek.com/home/setting-up-rrdrest-on-centos-8-or-almalinux-9/
I had issues installing RRDReST. I am guessing it had to do with it accessing files. I was able to install it in a docker container.
sudo yum install -y docker docker-compose
sudo systemctl enable docker
Create docker compose file with the following options
vi docker-compose.yml
Change the TZ to your time zone. If you have issues with the graphs, most likely something is off with the time zone between this container and Grafana/LibreNMS server
version: "3.5"

services:

  rrdrest:
    image: michaelwadman/rrdrest:latest
    container_name: rrdrest
    restart: always
    volumes:
      - "/opt/librenms:/opt/librenms"
    environment:
      - TZ=America/Denver
Save the file and start and setup the container with
sudo docker-compose up -d
You will need your docker container IP address to setup the connection in Grafana
sudo docker exec -it rrdrest ip addr | grep eth0
Congratulations. You should now have a RRDReST docker container that will auto start on system boot and has the correct time zone.
Basic steps are as follows
There is not anything special with installing Grafana on the same server as LibreNMS. You can follow the official guide to install it
https://grafana.com/docs/grafana/latest/installation/
After Grafana is installed, install the JSON API data source. You can do this using the grafana-cli
grafana-cli plugins install marcusolsson-json-datasource
A note on SSL/TLS certificates. If you have an SSL certificate for LibreNMS, you can use it for grafana. If you run into issues, try copying the cert (fullchain.pem, privkey.pem) to /etc/grafana/
You’ll most likely need to change owner
sudo chown root:grafana /etc/grafana/*.pem
And maybe the file permissions.
sudo chmod 640 /etc/grafana/*.pem
This is fairly straight forward.
grafana-cli plugins install marcusolsson-json-datasource
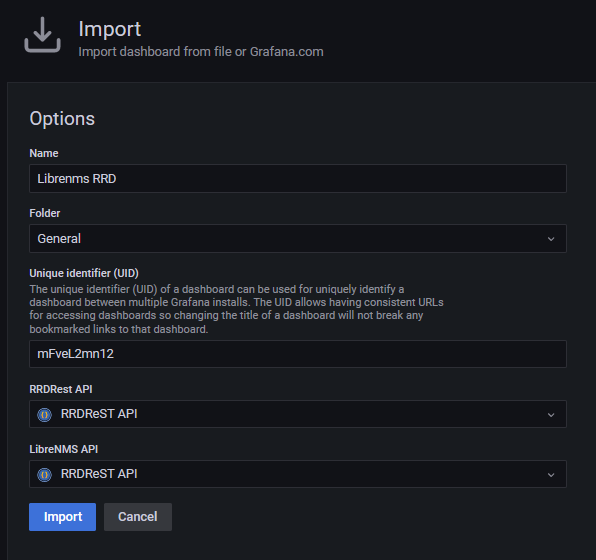
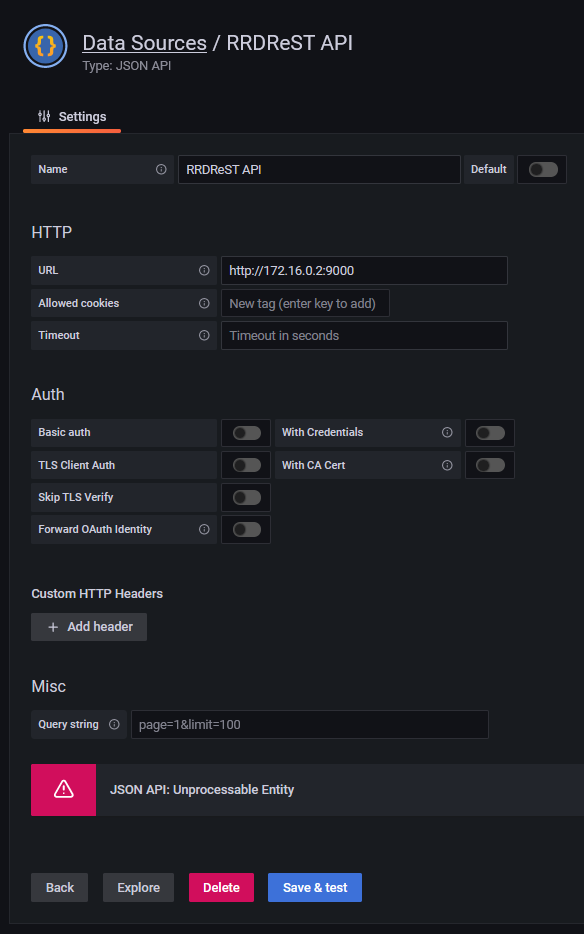
In Grafana, go to Configuration -> Data Sources -> Add data source
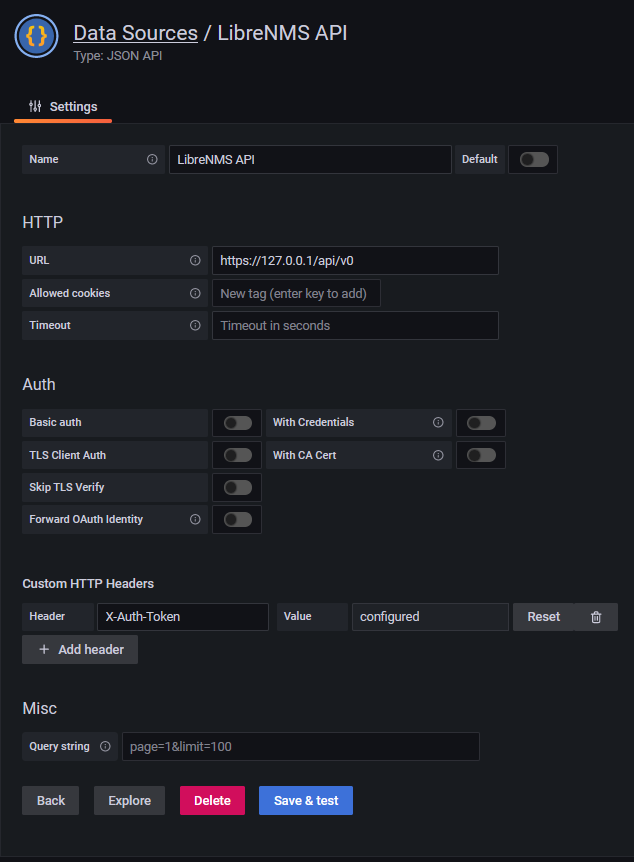
In Grafana, go to Configuration -> Data Sources -> Add data source
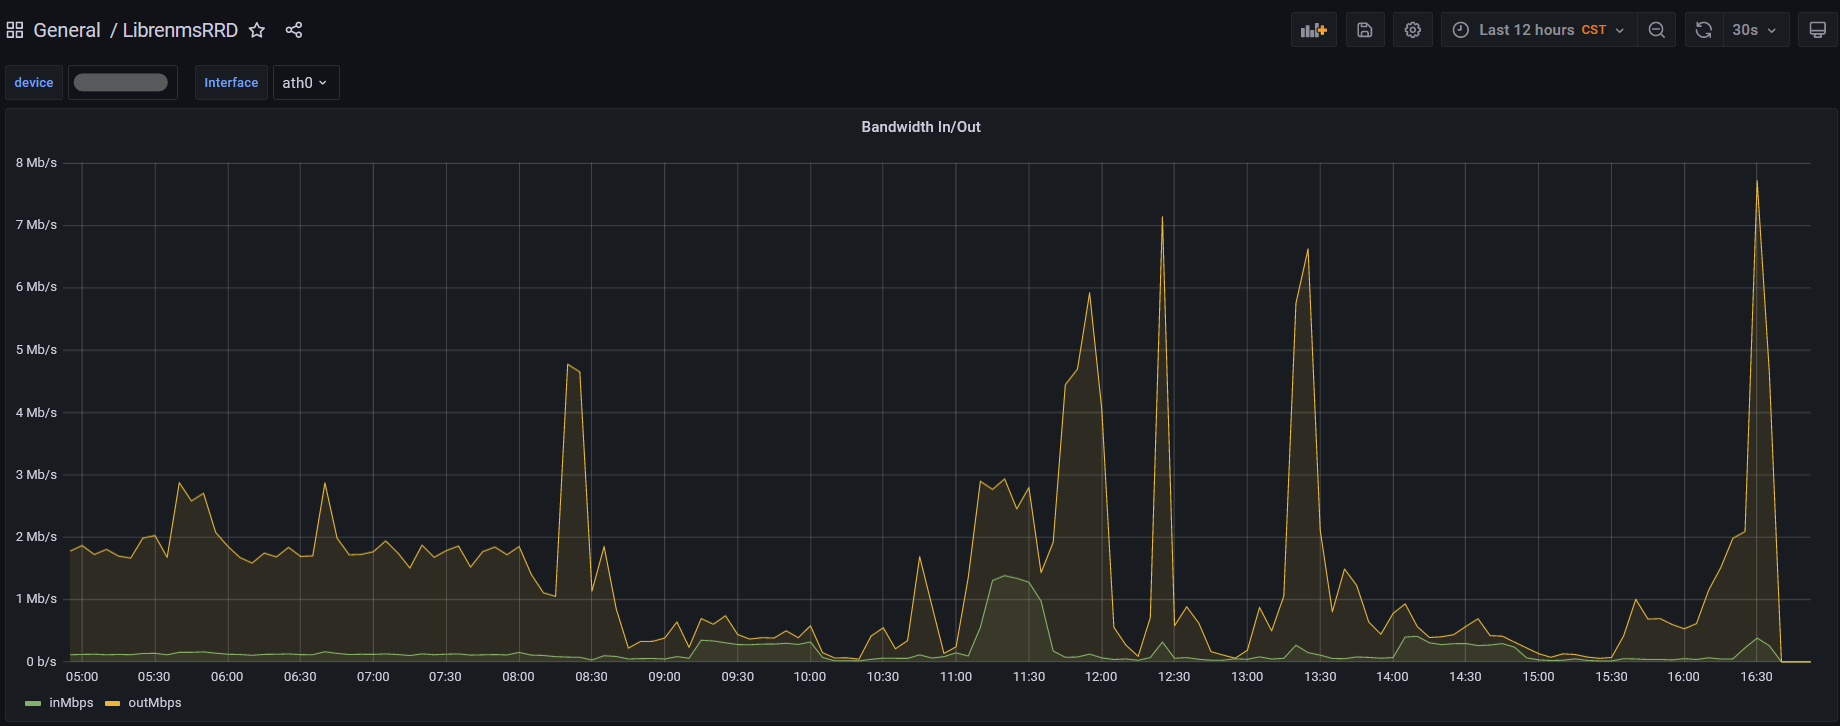
You should now be able to view your dashboard and use the drop down menus to select devices
There were a couple of issues I ran into while trying to get everything working together.
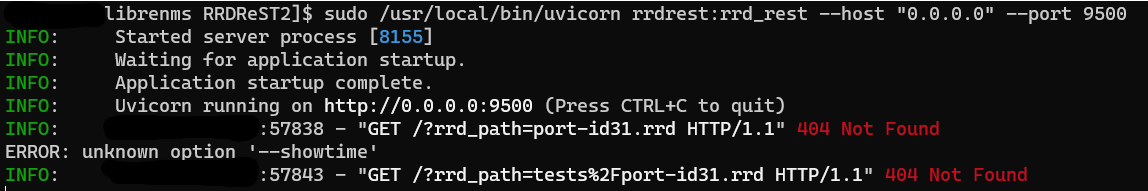
Issue: When trying to run RRDReST with uvicorn, I was never able to access the rrd files, even the test rrd files that are included when installing RRDReST. I am guessing it is either a permisions issue, or something unable to access the files.
Work around: Install RRDReST via Docker container.
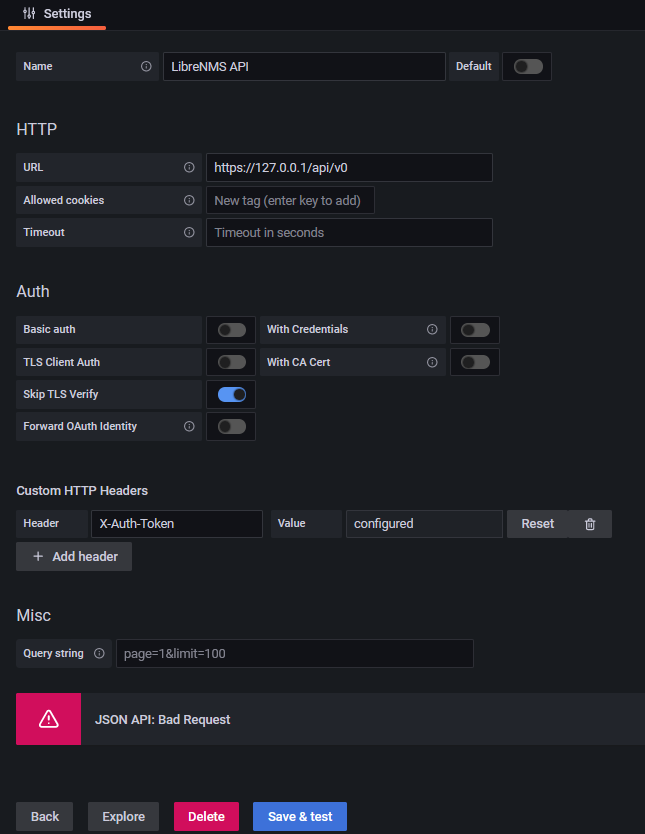
Issue: Get a “JSON API: Bad Request” when trying to set up the LibreNMS API Data Source in Grafana.
Work around: Install a valid SSL Certificate and set up a DNS record so you can access LibreNMS at librenms.yourdomain.com.
More info: I would assume that “Skip TLS Verify” would work with or without a valid certificate, but it would not work for me. There are potentially some other options with modifying how Nginx or Apache is set up that would get this working. If you setup Grafana to use a SSL certificate, you may need to copy the certificate files (fullchain.pem, privkey.pem) to /etc/grafana/ and run “chown root:grafana *.pem” to let grafana have access to the files.
Edit the rsyslog file
sudo vi /etc/rsyslog.conf
add the following. Change out the IP address for your remote syslog server IP address.
The syntax for this has changes. Newer recommended way is
*.* action(type="omfwd" target="192.0.10.5" port="514" protocol="tcp"
Old Syntax
## rsyslog Server
*.*     @10.0.10.5:514
https://www.rsyslog.com/sending-messages-to-a-remote-syslog-server/
Restart the rsyslog service and check your remote log server.
systemctl restart rsyslog
If you are having issues viewing logs in LibreNMS, try adding the hostname in the /etc/rsyslog.conf file
$LocalHostName server.hostname.com
Recently I started getting the following error while running ./validate.php.
$ sudo -u librenms ./validate.php
====================================
Component | Version
--------- | -------
LibreNMS | 21.8.0-41-g0a76ca4
DB Schema | 2021_08_26_093522_config_value_to_medium_text (217)
PHP | 7.4.20
Python | 3.6.8
MySQL | 10.5.10-MariaDB
RRDTool | 1.4.8
SNMP | NET-SNMP 5.7.2
====================================
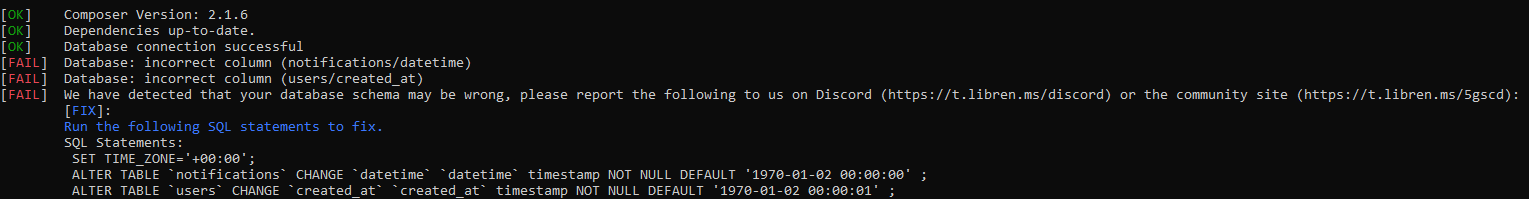
[OK] Composer Version: 2.1.6
[OK] Dependencies up-to-date.
[OK] Database connection successful
[FAIL] Database: incorrect column (notifications/datetime)
[FAIL] Database: incorrect column (users/created_at)
[FAIL] We have detected that your database schema may be wrong, please report the following to us on Discord (https://t.libren.ms/discord) or the community site (https://t.libren.ms/5gscd):
[FIX]:
Run the following SQL statements to fix.
SQL Statements:
SET TIME_ZONE='+00:00';
ALTER TABLE `notifications` CHANGE `datetime` `datetime` timestamp NOT NULL DEFAULT '1970-01-02 00:00:00' ;
ALTER TABLE `users` CHANGE `created_at` `created_at` timestamp NOT NULL DEFAULT '1970-01-02 00:00:01' ;Reading online it sounds like some of the recent changes are causing the issue. Looks fairly easy to resolve though.
First we’ll need to get a MySQL prompt. We’ll do that by running
mysql -u librenms -p librenms
It’ll ask use for the librenms user’s mysql password.
Once we have the MySQL prompt we can just copy and paste the commands in.
SET TIME_ZONE='+00:00';
ALTER TABLE `notifications` CHANGE `datetime` `datetime` timestamp NOT NULL DEFAULT '1970-01-02 00:00:00' ;
ALTER TABLE `users` CHANGE `created_at` `created_at` timestamp NOT NULL DEFAULT '1970-01-02 00:00:01' ;
Type ‘quit’ to exit MySQL and lets run the validate script again.
sudo -u librenms ./validate.php
Everything should check out OK.
SSH into LibreNMS server
ssh user@librenms-server
cd into the LibreNMS directory
cd /opt/librenms
Rename host
sudo ./renamehost.php old-hostname new-hostname
Example:
Note you can use IP addresses if the device is using that as the host name
sudo ./renamehost.php 192.168.1.209 192.168.2
You may want to check out these posts
You may get the following alert in LibreNMS. Basically you need to install python 3 to keep things up to date.
Python 3 is required to run LibreNMS as of May, 2020. You need to install Python 3 to continue to receive updates. If you do not install Python 3 and required packages, LibreNMS will continue to function but stop receiving bug fixes and updates.
Install Python 3 with yum, or apt if you are on a Debian based distro.
sudo yum install python3
sudo pip3 install -r /opt/librenms/requirements.txt
Run the following commands to make sure that LibreNMS is working correctly and is up to date.
cd /opt/librenms
sudo ./validate.php
sudo ./daily.sh