Thanks to the guys who put together the information at the following links.
https://wadman.co.nz/2021/01/02/Viewing-LibreNMS-data-in-Grafana/
https://www.reddit.com/r/LibreNMS/comments/ojc8cc/how_to_almost_natively_integrate_librenms_and/
I ran into some issues trying to get this to work. So here are some of my notes. I already had a LibreNMS installation set up.
- Install RRDReST
- Install Docker
- Configure Docker compose file
- Configure LibreNMS API User and Key
- Set up and Configure Grafana
- Install Grafana
- Install JSON Data Source Plugin
- Add LibreNMS API Data Source
- Add RRDReST Data Source
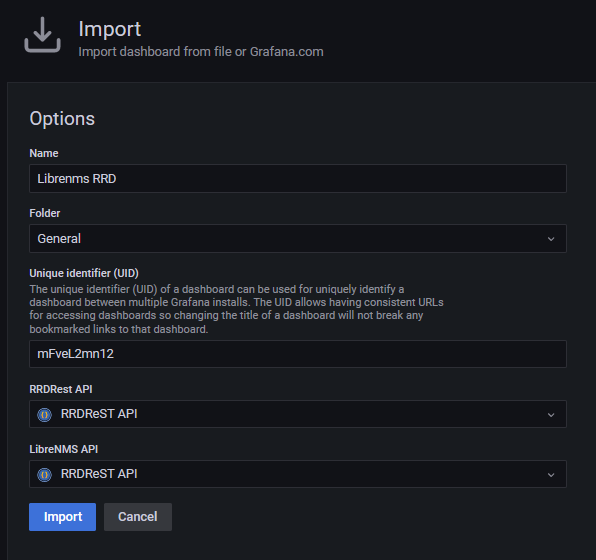
- Import Dashboard into Grafana
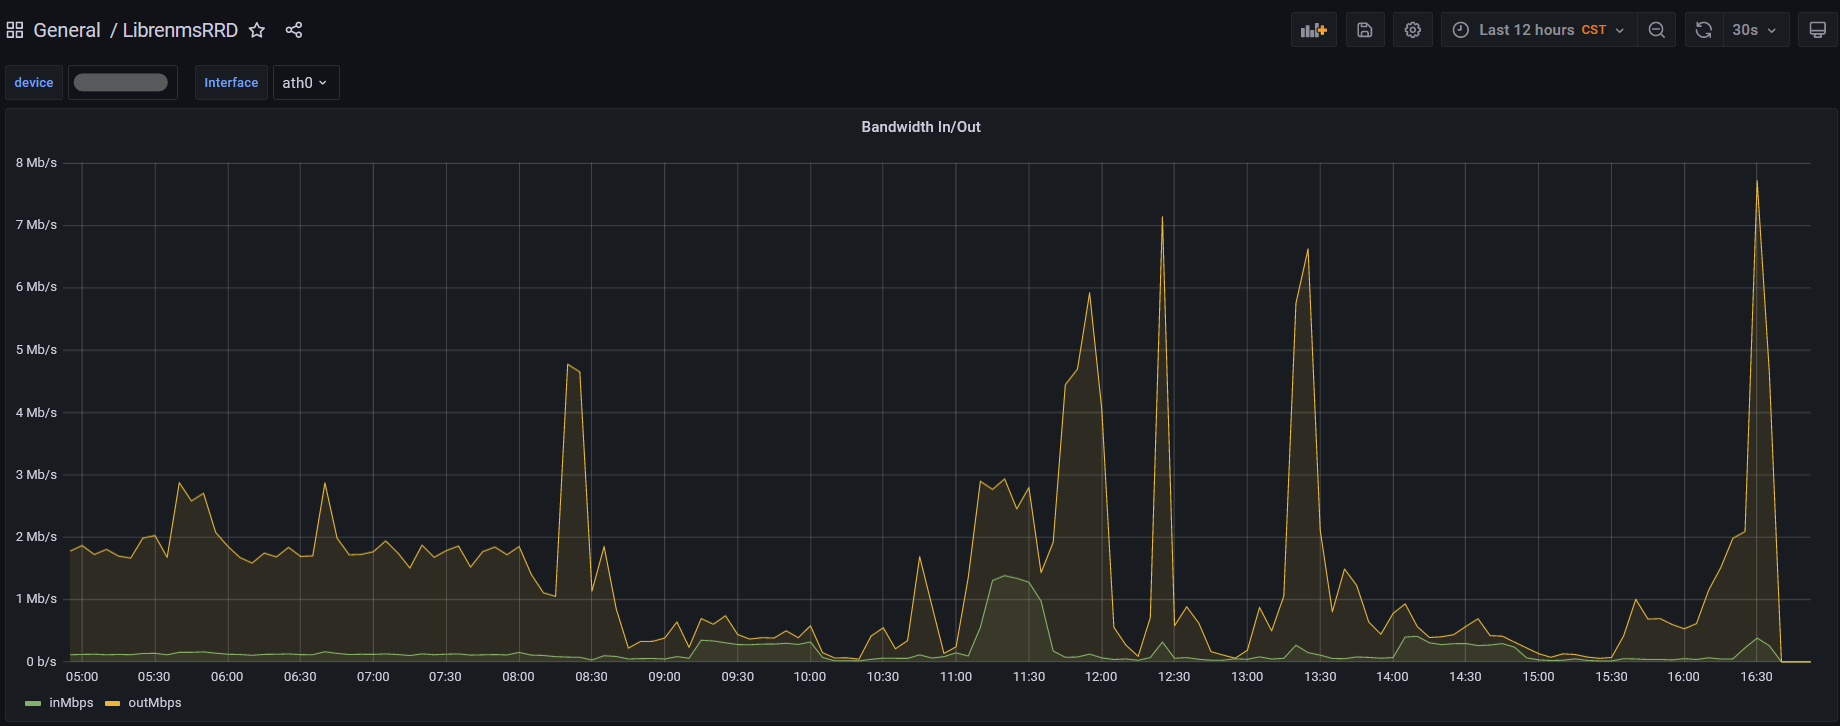
- View graphs
Installing RRDReST
NOTE FOR CENTOS 8, ALMALINUX 8 and 9
The steps for installing RRDReST are slightly different. Check out the following post.
https://www.incredigeek.com/home/setting-up-rrdrest-on-centos-8-or-almalinux-9/
I had issues installing RRDReST. I am guessing it had to do with it accessing files. I was able to install it in a docker container.
- Install Docker
- Create a compose file
- Install container
Install docker
sudo yum install -y docker docker-compose
sudo systemctl enable docker
Create docker compose file with the following options
vi docker-compose.yml
Change the TZ to your time zone. If you have issues with the graphs, most likely something is off with the time zone between this container and Grafana/LibreNMS server
version: "3.5"

services:

  rrdrest:
    image: michaelwadman/rrdrest:latest
    container_name: rrdrest
    restart: always
    volumes:
      - "/opt/librenms:/opt/librenms"
    environment:
      - TZ=America/Denver
Save the file and start and setup the container with
sudo docker-compose up -d
You will need your docker container IP address to setup the connection in Grafana
sudo docker exec -it rrdrest ip addr | grep eth0
Congratulations. You should now have a RRDReST docker container that will auto start on system boot and has the correct time zone.
Configure LibreNMS API User and Key
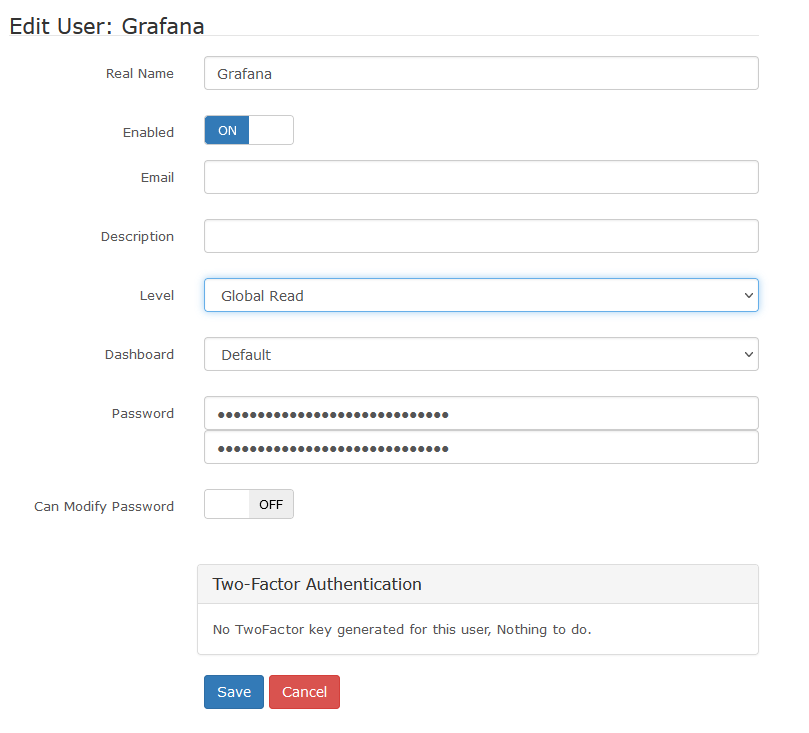
- Create a Grafana user in LibreNMS. (Settings Gear -> Manage Users -> Add Users)
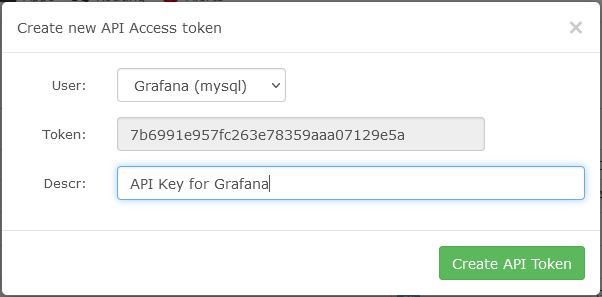
You could technically skip this step and use an existing user. - Create API token for the newly created user (Setting Gear -> API -> API Settings)
Set up and Configure Grafana
Basic steps are as follows
- Install Grafana
- Install JSON Data Source Plugin
- Configure Data Sources
- LibreNMS API
- RRDRest API
- Import Dashboard into Grafana
Install Grafana
There is not anything special with installing Grafana on the same server as LibreNMS. You can follow the official guide to install it
https://grafana.com/docs/grafana/latest/installation/
After Grafana is installed, install the JSON API data source. You can do this using the grafana-cli
grafana-cli plugins install marcusolsson-json-datasource
A note on SSL/TLS certificates. If you have an SSL certificate for LibreNMS, you can use it for grafana. If you run into issues, try copying the cert (fullchain.pem, privkey.pem) to /etc/grafana/
You’ll most likely need to change owner
sudo chown root:grafana /etc/grafana/*.pem
And maybe the file permissions.
sudo chmod 640 /etc/grafana/*.pem
Install JSON Data Source Plugin
This is fairly straight forward.
grafana-cli plugins install marcusolsson-json-datasource
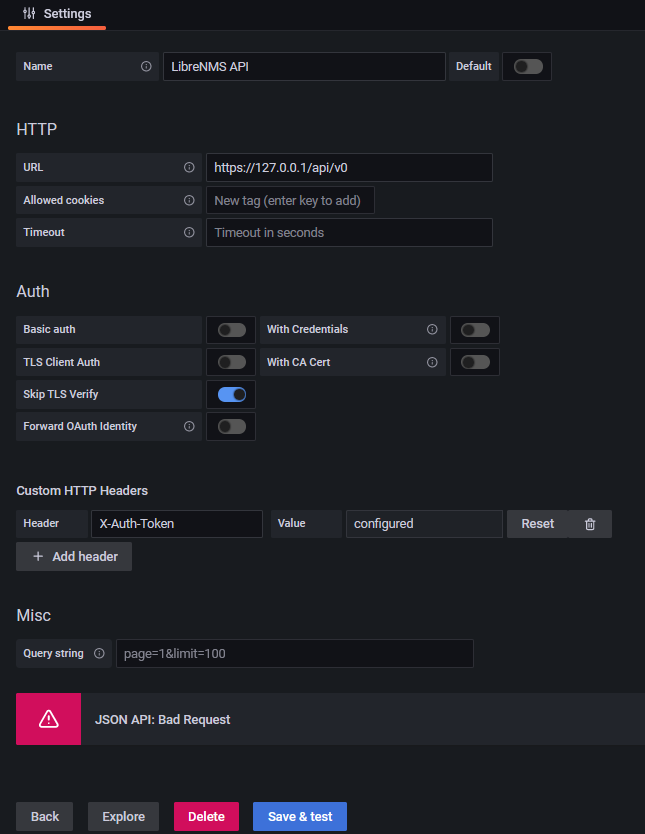
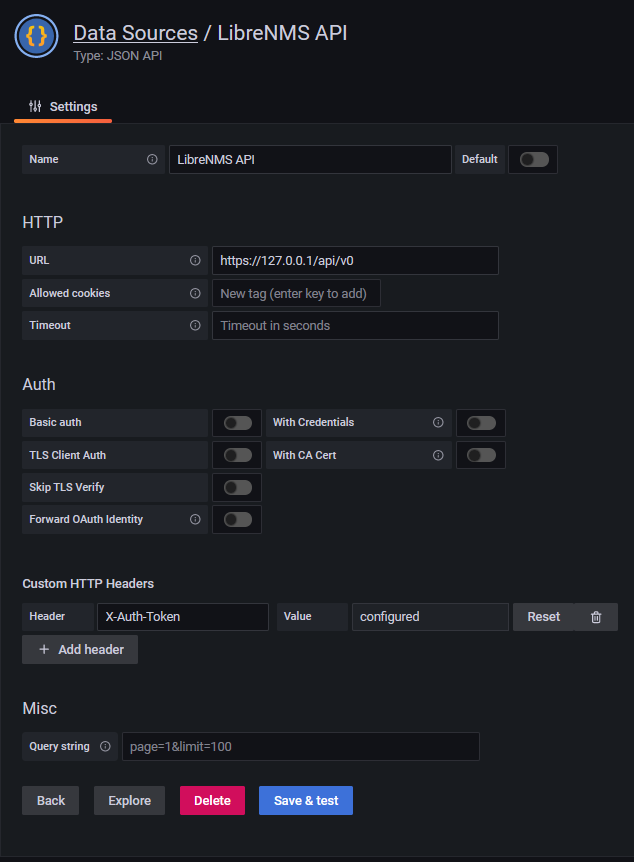
Add LibreNMS API Data Source
In Grafana, go to Configuration -> Data Sources -> Add data source
- Set Name for Data Source
- URL should be https://your_librenms_url/api/v0
- Add Custom HTTP Header
- Header field should be “X-Auth-Token”
- Value field should contain the API token we created in LibreNMS
- Save and Test
If you receive any errors, refer to the Troubleshooting part at the end.
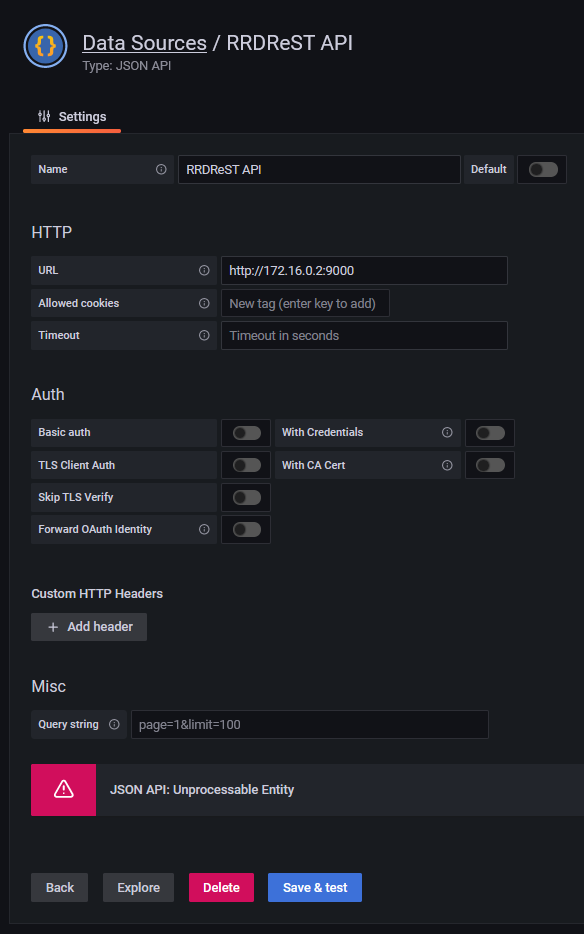
Add RRDReST Data Source
In Grafana, go to Configuration -> Data Sources -> Add data source
- Set Name for Data Source
- URL needs to be your docker container IP address (Steps above)
- Save and Test (Should return “Unprocessable Entity”)
You should now be able to view your dashboard and use the drop down menus to select devices
Troubleshooting
There were a couple of issues I ran into while trying to get everything working together.
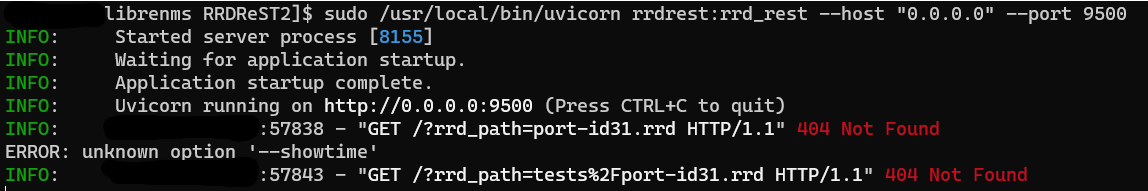
RRDReST shows 404 Not Found
Issue: When trying to run RRDReST with uvicorn, I was never able to access the rrd files, even the test rrd files that are included when installing RRDReST. I am guessing it is either a permisions issue, or something unable to access the files.
Work around: Install RRDReST via Docker container.
Error Adding LibreNMS API
Issue: Get a “JSON API: Bad Request” when trying to set up the LibreNMS API Data Source in Grafana.
Work around: Install a valid SSL Certificate and set up a DNS record so you can access LibreNMS at librenms.yourdomain.com.
More info: I would assume that “Skip TLS Verify” would work with or without a valid certificate, but it would not work for me. There are potentially some other options with modifying how Nginx or Apache is set up that would get this working. If you setup Grafana to use a SSL certificate, you may need to copy the certificate files (fullchain.pem, privkey.pem) to /etc/grafana/ and run “chown root:grafana *.pem” to let grafana have access to the files.